Citaat:
Oorspronkelijk geplaatst door Hoofdstraat

Die studie gaat dan ook over de praktijk en dat verschilt nogal eens van theoretische modellen, oa onderhoud maar ook meer dan verwachte slijtage. Vooral in offshore waar onderhoud een stuk moeilijker is en materiaal meer aantast door de zee.
|
Ik heb enkele vbn uit de praktijk gegeven, zelfs de oude windturbines uit 198x draaien zelfs meer als 20 jaar.
Citaat:
|
"The load factor for turbines built on platforms in the sea is reduced from 39 per cent to 15 per cent after 10 years"
|
Totale onzin of achterhaald, en bij windturbines spreekt men in de regel over capacity factor.
Citaat:
|
De toekomstige modellen gaan allemaal beter zijn maar het is afwachten of dat allemaal zo zal zijn, het blijkt nu ook dat grote modellen ook vlugger verslijten dan kleine.
|
Alweer uit uw duim gezogen.
Nieuwe technieken verbeteren de duurzaamheid bvb windturbines,
bvb 10% minder belasting op de wieken, en toch meer capacity factor.
Studie vergeleken met hydropower:
Citaat:
https://www.greentechmedia.com/artic...020#gs.oMgyxwc
Innovation is powering wind to reliability
The capacity factor of the U.S. wind fleet has steadily risen over time, reaching a record 34 percent in 2014 before dropping to 32.5 percent in 2015 on account of a continent-wide wind drought. Through November 2016, the fleet was tracking just behind 2014 levels.
Technology has largely driven the increase in wind’s capacity factor, as taller turbines with longer blades now harvest more kinetic energy from faster winds, over a larger swept area. Capacity factor last year for U.S. wind projects built in 2014 averaged 41.2 percent, compared to 31.2 percent for projects built in the 2004-2011 timeframe.
These new wind farms have steadily increased the capacity factor of the American wind fleet. Even as wind’s expansion has moderated from its pace of five years ago, the current five-year annualized growth rate (about 15 percent) would result in a doubling of the fleet in five years.
Extrapolating the eight-year trend in wind and hydro capacity factors gives a crossover point in 2021 at a capacity factor around 36 percent.

“Orthodontics for wind farms”
Capacity factor improvements have not been limited to new wind farms. Technological innovations have made it possible to optimize existing wind farms as well. In forested areas, remote sensing and computational flow dynamics can inform changes to the local cultivation of trees, which can improve energy production with minimal impact. Five forested sites for which SgurrEnergy has consulted in Sweden and the United Kingdom have seen increases of 1 percent to 5 percent in annual energy production (AEP).
Other solutions are more broadly applicable. Ground-based lidar can be used to optimize wind turbine generator alignment to ensure the rotor plane stays perpendicular to the wind and harvests a maximum of energy. SgurrEnergy’s experience with its Galion Lidar has been that such yaw correction typically improves AEP by 1 percent to 2 percent. We have observed a further 1 percent to 3 percent AEP increase through improved control strategies.
Independently verified results on a Clipper C96 2.5-megawatt turbine at the University of Minnesota found that SgurrOptimizer’s Individual Blade Controller also reduced blade loads by 10 percent, suggesting O&M cost savings of up to 5 percent should be achievable. Finally, aerodynamic enhancement of turbine blades -- typically by the installation of vortex generators to improve airflow near the surface -- has been found to increase AEP by 2 percent to 3 percent for older blade designs.
Individual Blade Controller Performance

Together, these techniques -- labeled “orthodontics for wind farms” by some -- can make for a 4 percent to 8 percent increase in AEP, independent of forestry-related gains and O&M cost savings. Taking the middle range, their application across the U.S. wind fleet would raise its average capacity factor from 32.5 percent to 34.5 percent. If such a change could be effected overnight, the expected wind-hydro capacity factor crossover point would come forward to 2018.
|
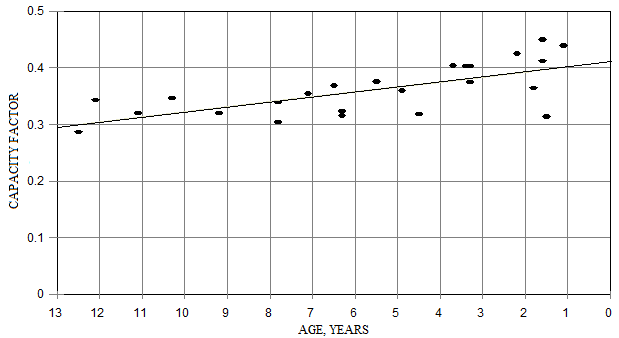
CF van UK statistisch, enkel offshore:
Figure 2 is an XY plot of the latest running 12-month capacity factors, which according to Energy Numbers run from January 2016 to January 2017, against the age of all 24 offshore wind farms. Capacity factor is moderately correlated with age (R^2 = 0.47) with the trend line showing the oldest plants achieving capacity factors of around 30% and the most recent ones factors of around 40%: